

SPOTIFY STREAMS EMPIRE - Top 10 Most Played Tracks
INTRODUCTION
This article is part of my case study project for the Google Data Analytics course conclusion.
I used data from the Chartmetrics platform, collected on December 19, 2024, at 2:25 pm. I only considered the artist-level data and applied the following filters:
- ISRC
- Spotify Streams
- Spotify Playlist Count
- Spotify Popularity
- Spotify Playlist Reach
- Last 28 days
I obtained a CSV file with cumulative numbers of track streams. It had 51 rows who was imported into Excel for cleaning to:
- Consider only artists at the “superstar” level (manual exclusion)
- Delete duplicate songs (explanation about ISRC in the article below) (exclusion with the help of filters)
As a result, 24 rows remained (including the header). Initially, I built the board with all this data, but the excessive amount of information was interfering with the visualization without delivering a proportional cost-benefit relationship.
In the end, I chose to keep only the top 10 tracks with the highest number of streams on Spotify.
INSIGHTS
TIME AND CUMULATIVE STREAM RANKINGS
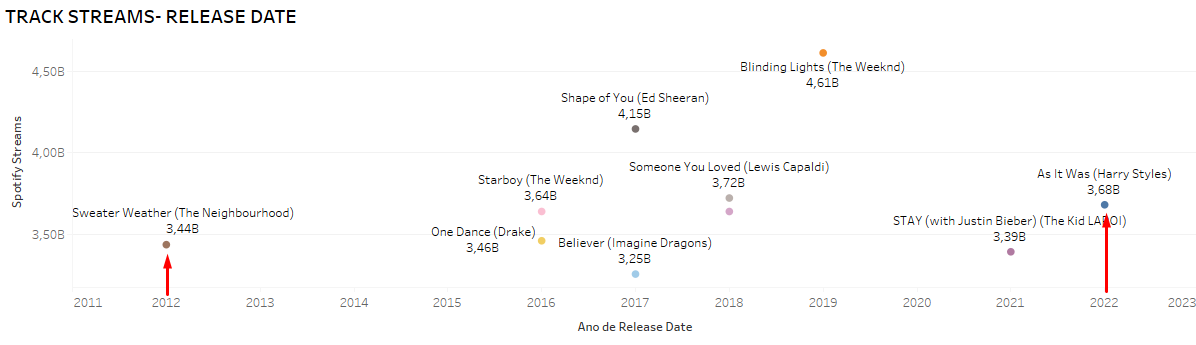
It takes time for a track to reach Spotify’s top 10 cumulative streams. The newest track in the ranking (“As It Was” by Harry Styles) was released in 2022 (2 years prior to the data collection), and the oldest track in the ranking (“Sweater Weather” by The Neighbourhood) came out 12 years before collection, in 2012.
CLASH OF GIANTS
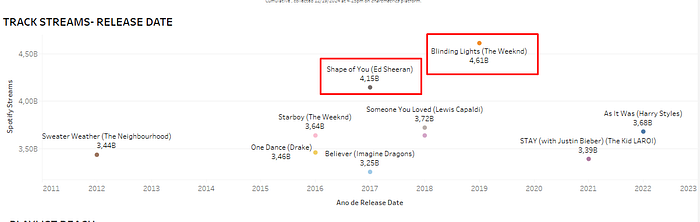
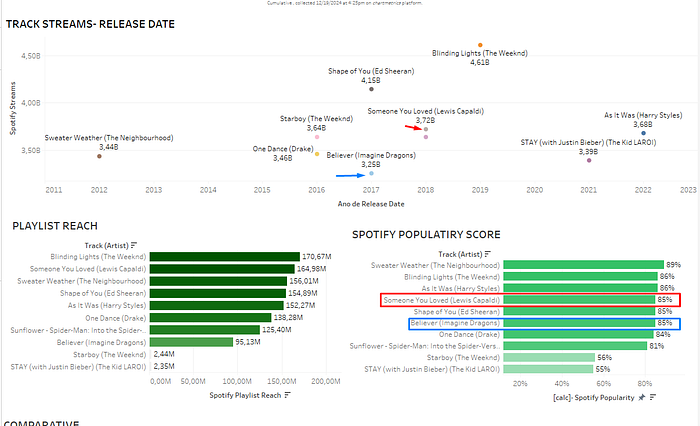
At least 3.25 billion streams are needed to be in this top 10, but only two tracks have surpassed 4 billion streams. Of these two, only one exceeded 4.5 billion:
Blinding Lights (The Weeknd), 2019, 4.61 billion
Shape of You (Ed Sheeran), 2017, 4.15 billion
Press enter or click to view image in full size
THE ROLE OF SPOTIFY POPULARITY IN STREAM VOLUME
It would be expected that all top 10 songs have high Spotify popularity scores, but even with popularity below 60% (on a 0–100% scale), two songs made it onto the list:
Starboy (The Weeknd), 2016, 56% Spotify popularity
STAY (with Justin Bieber) (The Kid LAROI), 2021, 55% Spotify popularity
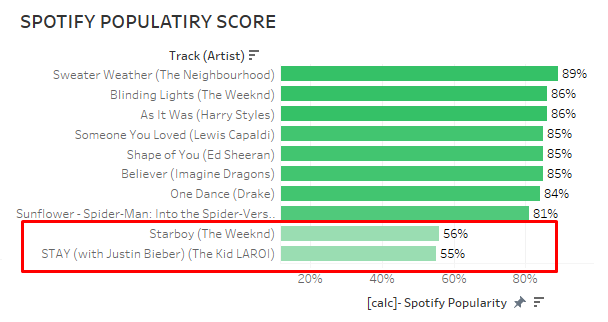
Considering the high streaming numbers, it’s possible these tracks had a strong viral period that propelled them into the ranking. Given the difference in popularity between these two songs and the other tracks on the list, it’s likely they are no longer as viral compared to the other tracks on the ranking.
However, it’s notable that a 2012 track has a higher Spotify popularity score than the number one on ranking, this track is:
“Sweater Weather” (The Neighbourhood), 2012, 89% Spotify popularity
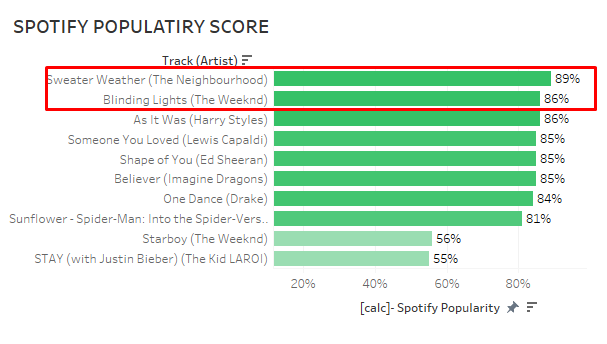
This indicates a current presence of that track among users who most frequently use Spotify, possibly due to external factors. To detail these factors, it would be necessary to access daily streams, identify spikes, and follow up with an in-depth analysis.
Nevertheless, it’s essential to note that Spotify’s popularity score alone is not enough to determine a track’s position in the streaming ranking.
Both “Believer” (Imagine Dragons) and “Someone You Loved” (Lewis Capaldi) have an 85% popularity score. Yet, there is a difference of approximately 900 million plays between the two.
Press enter or click to view image in full size
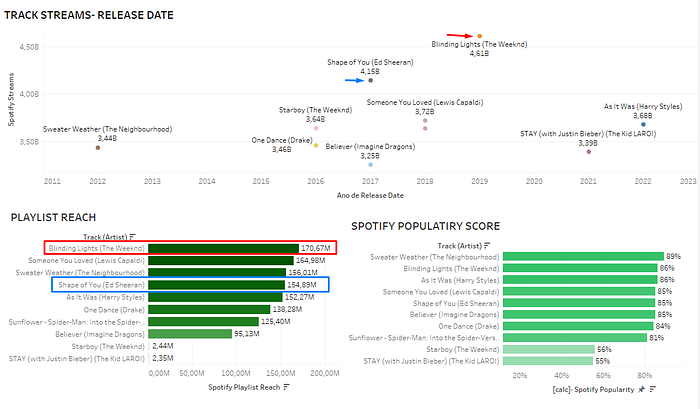
This also happens with “As It Was” (Harry Styles) and “Blinding Lights” (The Weeknd). Both have 86% popularity, but there’s a gap of roughly 930 million streams. In this case, that gap is enough to put “Blinding Lights” in first place and “As It Was” in fourth place.
Press enter or click to view image in full size

RELATIONSHIP BETWEEN SPOTIFY POPULARITY AND PLAYLIST REACH
Considering the two pairs of songs mentioned above, we can identify another factor that significantly contributes to a track entering the list of most-played on the platform: the Spotify Playlist Reach metric.
This metric acts like a “forecast” of how many people may listen to the song. To compute it, all playlists that include the song are considered, along with the number of listeners for each playlist.
The assumption is that playlist listeners will inevitably come across the song in question, thus triggering a stream count.
“Blinding Lights,” with 4.61 billion streams, ranks number one in both total streams and playlist reach. It has roughly 15.7 million more in playlist reach than the second-place track, “Shape of You” (Ed Sheeran).
Press enter or click to view image in full size
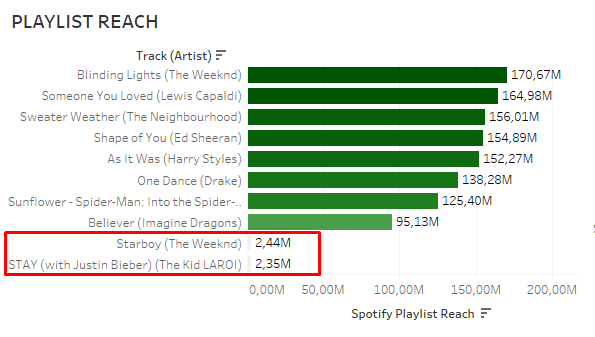
Therefore, a common trait for making this ranking of Spotify Streams Empire is combining solid popularity (which typically means higher than 80%) with a considerable playlist reach (above 95 million).
Almost every rule has it’s exception, and here I will follow this path. In the top 10 rank we have two exceptions to this rule. The two songs who that appear on the list even having low Spotify popularity and low playlist reach. These are the songs that seem to have had a viral period prior to the analysis:
“Starboy” (The Weeknd), 2.44M playlist reach, 56% Spotify popularity
“STAY (with Justin Bieber)” (The Kid LAROI), 2.35M playlist reach, 55% Spotify popularity
THE ROLE OF EXTERNAL FACTORS
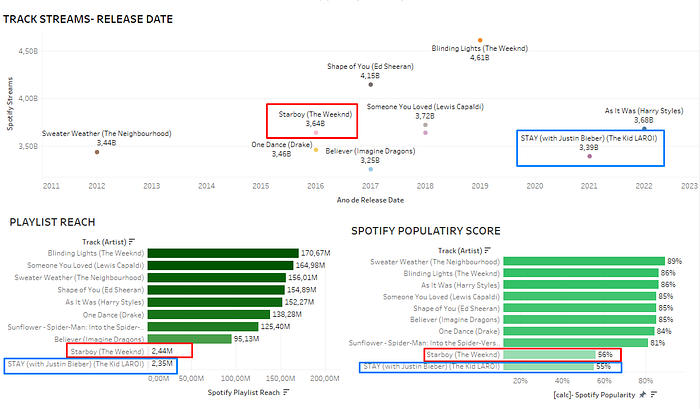
As sayed before, It’s noteworthy that both “Starboy” (The Weeknd) and “STAY (with Justin Bieber) (The Kid LAROI)” stand out as exceptions to the rule (having low playlist reach and low Spotify popularity). Even yet, they have more streams than other songs:
“Starboy” (The Weeknd) — 6.64B (fifth position)
“STAY (with Justin Bieber) (The Kid LAROI)” — 3.39B (ninth position)
“BELIEVER” (Imagine Dragons) — 3.25B (tenth position)
Press enter or click to view image in full size
This finding reinforces the influence of external factors (such as seasonal viral moments). However, a deeper analysis would require more granular data, as well as cross-referencing with other artist platform data and media mention to find out what happens to this tracks and when.
On the other side, with this information it’s possible to infer correlation between Playlist Reach and Spotify Popularity. It’s seems to be popular the track need to “networking” with playlists.
INSIGHTS CHECKLIST
Data continues to talk to us every time we focus again on it, but it’s necessary to know the time to stop analysis. This time is when our business question can be answered with confidence or when we find it’s not possible with actual data.
In this case study, the key takeaways identified during the analysis was:
- It’s unlikely for a track under two years old to be among Spotify’s Empire Streams (top 10 cumulative streams).
- The release year demonstrate low relation to ranking.
- Join of Spotify Popularity more than 80% and Playlist Reach more than 95 M increase the chance to a track be on this rank.
- It’s possible to infer that a good viral track moment(s) have force enough to maintain it on top 10 cumulative most executed even when the popularity decrease.
- Only The Weeknd have two positions (first and
- fifth) in the Spotify Empire Streams Track, demonstrating his strong market presence.
CASE STUDY LIMITATIONS
While it was useful for developing my case study project for the Google Data Analytics course, in a real-world context, the database used here would be sufficient only as a starting point.
In a real business setting where data is used to guide strategic decisions, more data and greater granularity are needed to confirm or disprove the patterns found in this initial analysis.
Moreover, it’s important to ensure that cumulative streams aren’t used as a vanity metric, since royalties aren’t only paid at the end of a unique cumulative period.
Ultimately, in the music business context, streaming data is meant to assess the efficiency or inefficiency of marketing campaigns, promotions, and the artist’s brand power.
With deeper data access it’s possible to find patterns to indicate if boots are been used to up the numbers.
Still, even with a limited database I had access for this case study, it’s possible to spot patterns — demonstrating the importance and strength of data, which motivates me to keep learning.
MAIN LESSONS LEARNED
About the bumps along the road and the lessons gained during the development of this case study, I learned to be more patient and picked up so many things that I’m considering writing a new article about it.
The data was organized, but between extraction and conclusion, I confess I ran into obstacles at every possible stage:
- R Studio
- Pivot Table
- Python
- Tableau
There were so many caution points and complicated moments that it feels like my brain focused on learning a few things deeply, just to avoid going through it all again, haha.
Throughout the process, I stayed focused on the end goal, dropping tools if necessary and being extra careful with logical reasoning to reduce bias as much as possible.
Speaking of bias, other analyses could be done with this top 10 list, but I stuck to streaming numbers to better define the scope of this case study, and not because I didn’t see it.
I also wanted to make the most out of the trial period offered by Chartmetrics (ideally, I would use the API, but that would have added a layer of complexity that wasn’t cost-effective for me at that time).
Even so, I’m glad I now notice gaps I couldn’t fill and feel uneasy about some shallow parts; it shows I’m developing the critical thinking needed to perform solid analyses regardless of the technology used.
This project is an important step in my new phase, and I realize it was a good decision to strengthen my data analysis skills. It allows me to continue generating insights in a more professional way, pavement a solid path to machine learning.
I HATE YOU THAN I LOVE YOU (MAIN LESSON HARDLY LEARN)
“I’m so happy I finally start my case study”
“Why it’s so hard??”
“I never will finish this case study”
“I’m so happy to be done this case study”
As you possibly imagine, I faced some technical challenges that were obvious at first glance and others that required a bit more work with the numbers.
The first was understanding what “ISRC” meant.
After a quick initial search, I compared the acronym to the music’s Personal ID. But then I realized it was more like an “email”. Every time a track is placed on an album, recorded live, included in a compilation…
A new ISRC is generated. It doesn’t reference the song itself about originality, arrange but rather the existence of a specific song in a specific location. Each location generates an ISRC (it’s necessary to collect royalty).
I was concerned the numbers might be incorrect, but Spotify itself saved me.
Checking the platform, I noticed that a single track, even if it’s in multiple places, always shows the same number of streams. So, I understood that streams generated by the various ISRCs a track might are already compiled, no matter which ISRC I pick.
Therefore, the main concern was checking for any duplicate songs.
A second issue, related to how I was handling the data, was failing to notice that the numbers were written in the U.S. format while my Excel was set for Brazil’s format.
So, I had to start over, paying attention to that difference.
Partway through, I realized working with such large numbers wasn’t productive. Those giant numbers were cluttering the board and not adding much extra value.
The alternative was to reduce the numerical detail — for example, going from “4612896316” to “4.61B.” This made the board much cleaner and the analysis easier to follow.
The downside was that I ended up showing the same number of streams for two tracks: “Starboy (The Weeknd)” and “Sunflower — Spider-Man: Into the Spider-Verse (Post Malone).”
I’ll be honest here: I couldn’t increase just these two cases’ decimals on the board without cluttering everything else. So, I left them As It Was.
If it were a real presentation, I would provide the cleaned data used to create the board as an attachment, since this coincidence didn’t affect the overall reasoning.
Even doing this, in the real scenario I will explicitly state it in the presentation introduction and in the static board’s footnotes. Of course, supposing I will present to stakeholders who prefer the big picture view.
Moving on to other choices in the analysis, when I collect the data, I had access to the “Moods” column, which returned something like “Blue Sexy Warm Dark Serious.”
I know there are dedicated libraries for musical analysis, but since I’m not familiar with how they work or what they consider as “blue,” for example, I decided not to use that column.
Getting to this point, I feel like It was a slap in my face because means to accept my current limitations and focus on producing the best analysis possible with the knowledge I had.
In data analysis, just like so many other areas in life, knowing when to say “no” is crucial.
After pass to all this I thought the next part would be easier:
I came from the arts (I have a Music degree),
I’m a creative guy,
I like to play with photoshop
Of course, I will have so much fun doing the board.
This not happens!
Tableau was a bit of a thorn in my side at first. This was my first board, and it was quite challenging.
I’m glad I stuck with it, because now I feel relieved when I open the program, knowing it’ll make my life easier.
It was one of those slow-burn loves: no spark at first sight, but it grew on me later, haha.
This reminds me to note that, in the interest of simplifying the process, I decided not to continue with R. Talking to a friend in the field (thank you Laís!), I learned that most libraries used with R can also be used with Python.
Since my main goal in all this is to become a competent AI engineer, I saw no reason to invest precious time in R when I could go straight into a serious Python study, which will be my go-to language for most of my day.
The result? Farewell, R (at least for now).
REFLECTIONS ON THE MUSIC INDUSTRY
One thing many people don’t understand is that music is also a business. At the end of the day, what sustains a long career is a well-structured business plan that brings returns to investors (even if the investors are the artists themselves).
And this isn’t necessarily connected to the artist’s skill or sensitivity level. There are many variables that must come together for everything to work out, and even more so to keep everything running smoothly over time.
We also have to factor in the changes we go through as individuals. If an artist starts a career at 17, it’s very likely that by 25 their worldview will be different. What worked before may no longer fit.
Not fitting anymore the old version can attract or repel investment, which affects reach and, consequently, the number of streams. I’m not here to dive deep into that, but rather to emphasize that no musical analysis is ever complete.
However, data analysis is not about solve all problem at once but directing eyes and attention to the specific problems or understanding we focus to find out.
Thanks for your attention, bellow you can access the link to board on Tableau Public: Click to access the board on Tableau Public
Here the playlist with the top 20: Spotify playlist link
PAULO H COSTA
*This article was published on my Medium Profile on January, 2025: https://medium.com/@paulohenriquefcosta/spotify-streams-empire-622b3f6a97d7


Muito inspirador, Paulo!O seu case sobre o Spotify Streams Empire mostra de forma muito clara como dados podem contar histórias valiosas e revelar padrões que não são óbvios à primeira vista. Gostei bastante de como você detalhou todo o processo de coleta, filtragem e análise mostrando que o aprendizado em Data Analytics vai muito além de ferramentas, é também sobre pensamento crítico, atenção aos detalhes e tomada de decisão baseada em dados.
Na DIO, valorizamos muito esse espírito de experimentar, testar e aprender com dados reais, pois ele não só fortalece habilidades técnicas como também prepara para interpretar cenários complexos de negócios e até do comportamento do usuário. A forma como você conectou Spotify Popularity, Playlist Reach e fatores externos mostra exatamente essa capacidade de traduzir números em insights estratégicos.
Me conta: olhando para frente, você pretende expandir esse projeto, incluindo análises preditivas ou Machine Learning para prever tendências de streams, ou acha que o próximo passo será consolidar mais dashboards de visualização e storytelling com dados para diferentes plataformas?