A partnership

BOOTCAMP
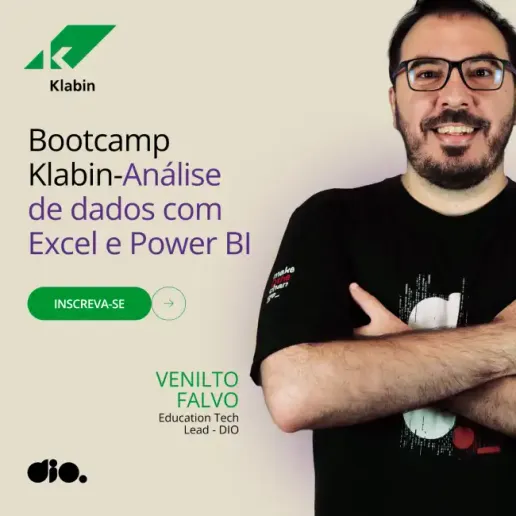
Klabin - Data Analysis with Excel and Power BI

Learn from data collection and modeling to creating interactive dashboards for decision-making, applying ETL, data cleaning, and storytelling with data, preparing you to work as an analyst in areas such as data analysis, M.I.S., and business intelligence.
- Microsoft Copilot
- Power BI


4.5+
More than 21979 students have already secured their free scholarship. Enroll now and guarantee your spot.
I already have an account. Log in.
0
Hours of content certified
0
Projects for your portfolio
0
Code challenge
Welcome, Klabin
The biggest!
Klabin is the largest producer and exporter of packaging papers in Brazil, founded in 1899 in São Paulo. It operates in the paper and pulp sector with a strong industrial presence.
Sustainability and innovation
It has 24 industrial units (23 in Brazil and 1 in Argentina) and manages approximately 544 thousand hectares of forests in three Brazilian states (Paraná, Santa Catarina, and São Paulo), including replanted and preserved areas.
126 years of pride
A large company with over 17,000 employees, headquartered in São Paulo, SP.
What You Will Learn

Evolve Skills
Study trending technologies, tools, and libraries worldwide.

Mentorship
Learn from renowned experts in live sessions.

Practical Challenges
Practice what you've learned and highlight your portfolio with practical projects.

Excel + Power BI Dashboards
Analyze, clean, and visualize data efficiently using SQL, Power BI, Excel, and Power Query. Transform raw data into strategic insights, creating interactive dashboards and management reports to support decision-making in companies.
The Differentiators That Take You Further
Build a sales management report in Power BI, transforming raw data into strategic information and creating customized visual components.
Make a corporate dashboard integrated with MySQL and Azure, connect the MySQL database in Power BI, and talk about cloud services configuration on Azure.
Use Power Query and Artificial Intelligence for data cleaning treatment, automations, and optimizations of data transformation live.


- 1Register yourself.
- 2Join live mentorship sessions with top market experts.
- 3Network and learn within a community.
- 4Practice with code challenges.
- 5Build your portfolio with practical projects.
Have your profile highlighted in Talent Match with real hiring opportunities.
YOUR NAME - Data Analyst
yourname@email.com.br(12) 3 4564-8910
DIO certification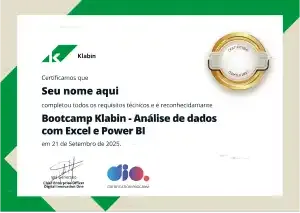
Skills
Microsoft CopilotPower BI
ProjectsContributing to an Open Source Project on GitHubBuilding Your First Logical Database ProjectBuild a Logical Database Project from ScratchCreating an Xbox Sales DashboardAnalyzing Data from a Sales Dashboard in Power BICreating a Sales Management Report with Power BICreating a Corporate Dashboard with MySQL and Azure IntegrationSales Dashboard with Power BI Using Star SchemaModeling an E-commerce Dashboard with Power BI Using DAX FormulasCreating a Management Dashboard for Decision-Making with Power BICreating Sales and Profit Reports with Data Analytics in Power BICreating Dynamic Reports Using Parameters in Power BI
Feedback Selection ProcessHired
Who Is This Bootcamp Recommended For?

Profile
Data Analysts, M.I.S. Analysts, and Sales Analysts who want to evolve their skills to transform data into interactive visual panels for decision-making.

Vacancies
Have your profile available for opportunities in one of the most sought-after technologies by DIO's partner companies in Talent Match.

Career
Prepare for upcoming opportunities and succeed in recruitment interviews.